
Dutch money questions are deceptively hard to answer. How much do I actually keep from a €45,000 salary? How much mortgage can I get? Is that pay raise worth it after tax and lost allowances? Each question sounds simple, but the rules behind them are fragmented across the Belastingdienst, Nibud, Dienst Toeslagen, and NHG, and they all interact. A higher salary lifts your net income, but it also shrinks your healthcare allowance and changes how much you can borrow. None of that is visible in a single calculator.
I kept running into this myself, and every time I went looking for an answer online I hit the same walls. The good calculators were single-purpose and siloed. Many were wrapped in ads, gated behind a lead form, or quietly tracking everything I typed about my own finances. And often the figures were a year or two out of date, which for tax brackets and allowance thresholds means the answer is simply wrong. That’s why I built Geldhoek.
The Problem: Fragmented Rules, Fragmented Tools
The Dutch fiscal system is not one calculation, it’s a web of them. Income tax has brackets that differ above and below state-pension age. On top of that sit the general tax credit, the labour tax credit, the elderly credit, and the income-dependent combination credit, each phasing in or out at its own income thresholds. Maximum mortgage depends on Nibud financing-burden norms, the interest rate, your existing debts, NHG limits, and even your home’s energy label. Allowances (healthcare, rent, child budget, childcare) each have their own income tapers and asset limits.
Because these rules are interlinked, answering one question properly means understanding several at once. But the tools online treat them as isolated. You calculate your net salary on one site, your mortgage on another, your allowances on a third, and none of them tell you how a change in one ripples through the others. On top of the fragmentation, using them often meant handing over personal financial details to sites I didn’t trust, or wading through ads to get to a number that might already be stale.
The Solution: Geldhoek
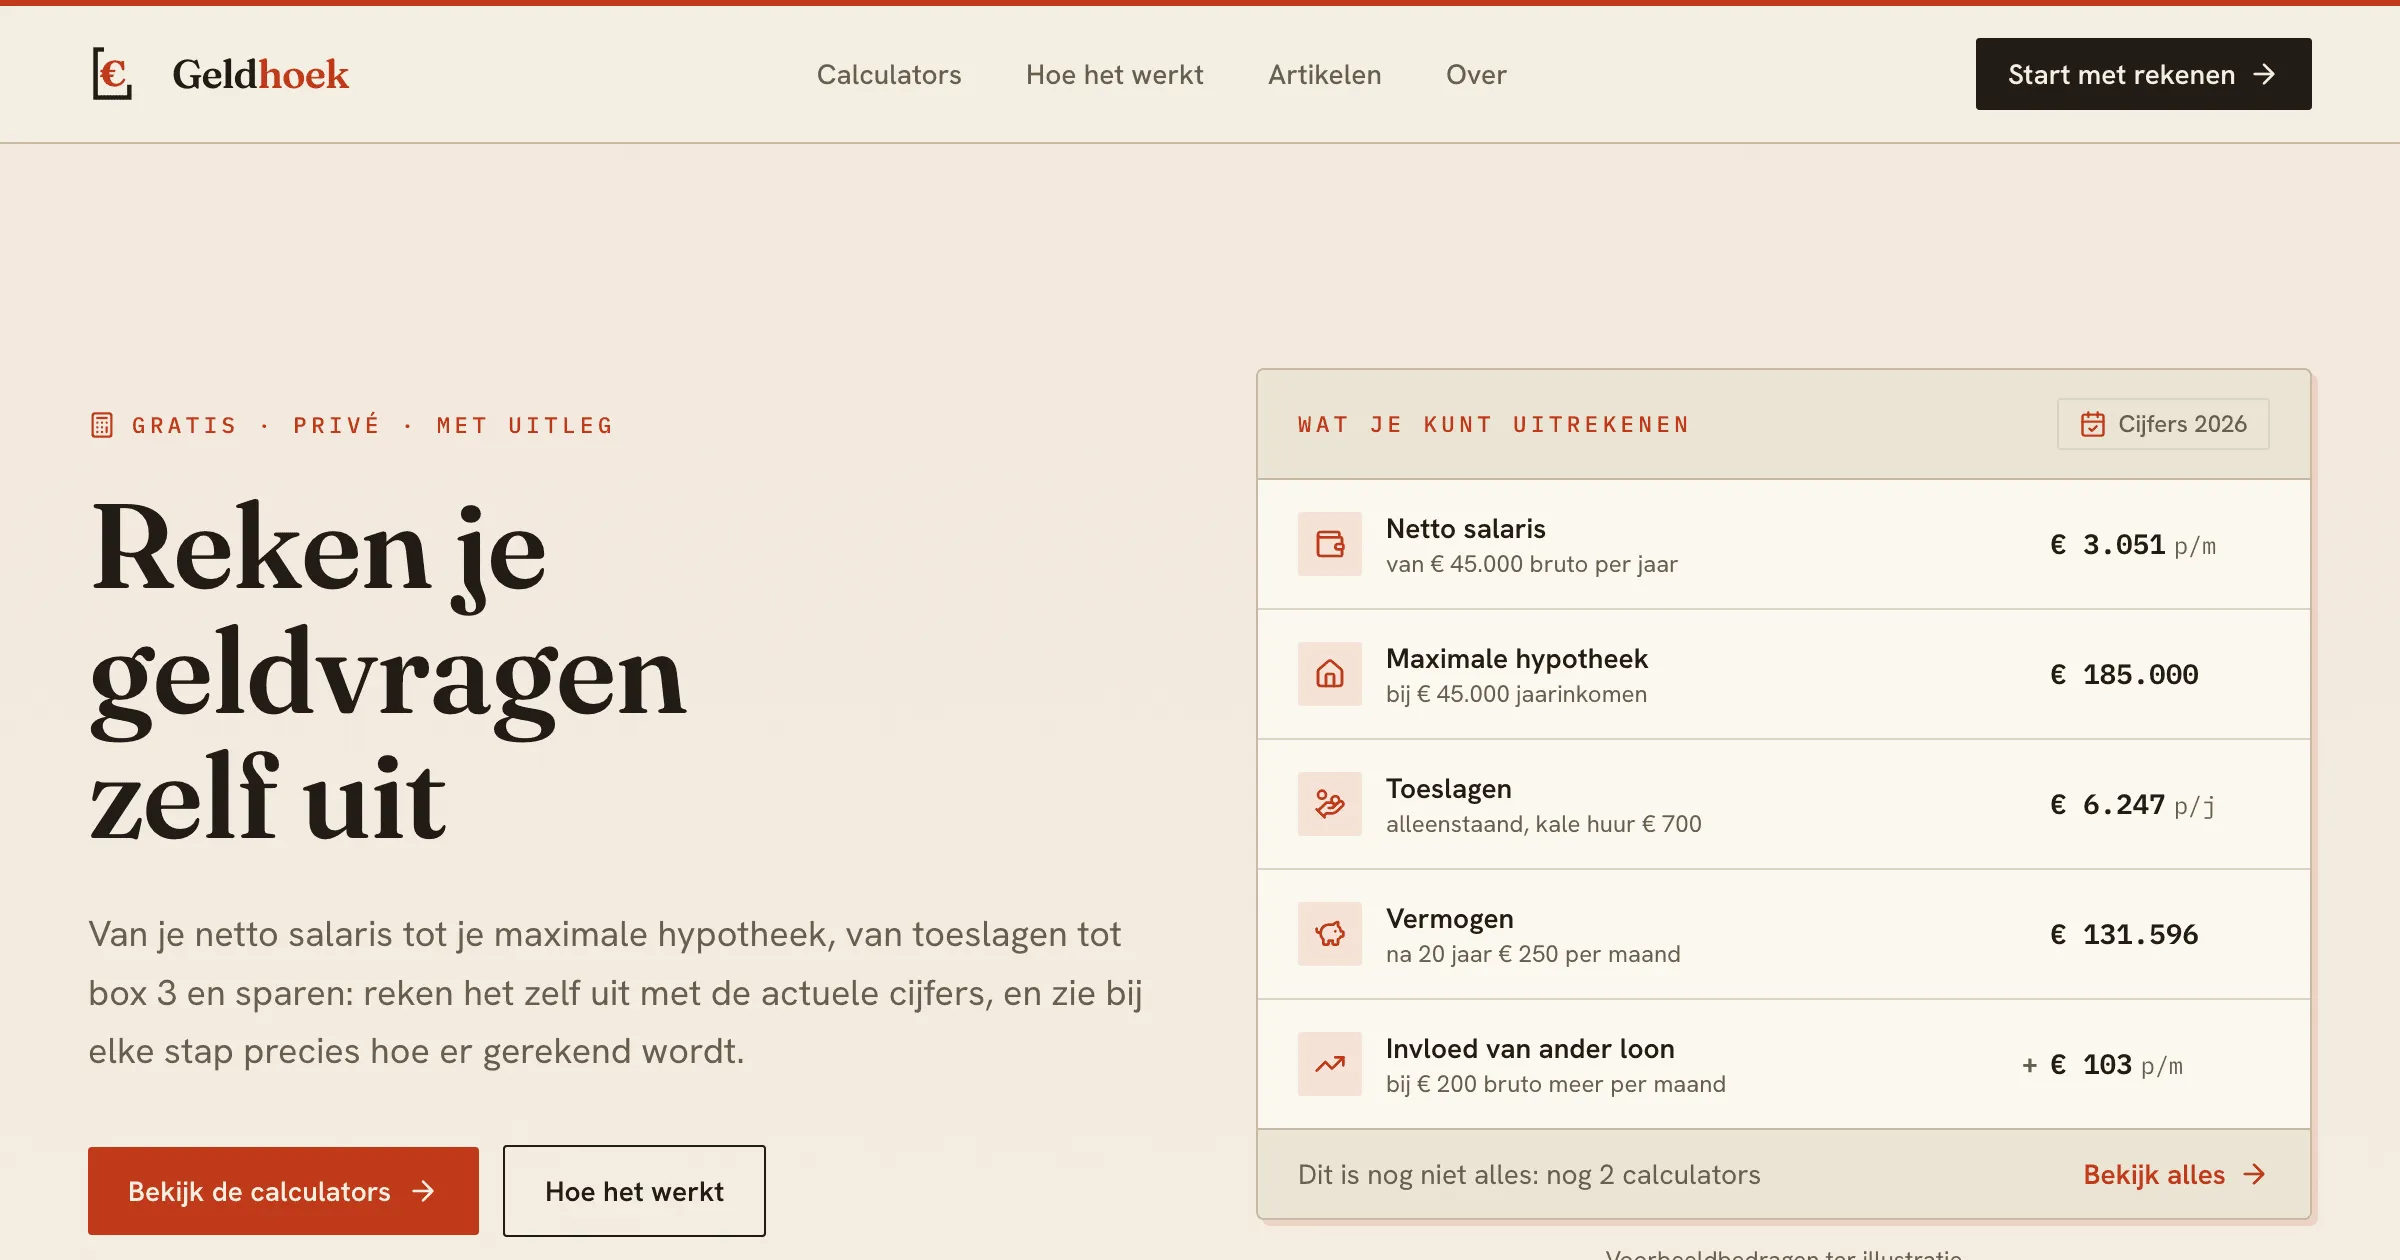
Geldhoek bundles these calculators in one place, built around three principles: privacy by design, a single verified source of truth for every fiscal figure, and full transparency about where the numbers come from. The tagline says it plainly: reken je geldvragen zelf uit, calculate your money questions yourself.
What I Built
The calculators. Geldhoek currently runs seven tools that share the same underlying tax logic:
- Net salary converts gross to net using the income-tax brackets, the general and labour tax credits, the income-dependent combination credit, pension premiums, the 30%-ruling for expats, and the taxable benefit (bijtelling) for a company car or bike, with the right rates for zero-emission and youngtimer cars and any personal contribution. A chart shows how your tax burden is built up, and an expandable explanation walks through every bracket and credit step by step.
- Gross from net runs that in reverse, from a target net salary to the gross you need, including how your annual income is split across monthly pay, holiday allowance, and extras, and any taxable benefit for a company car or bike.
- Salary impact is the most complete tool. It fully computes two salary situations side by side, showing the effect on your net income, on all four allowances (healthcare, rent, child budget, childcare), and on your maximum mortgage. This is exactly the interplay single-purpose tools hide, where a raise adds net income but costs allowance and shifts your borrowing capacity.
- Allowances estimates healthcare, rent, child budget, and childcare allowance in one form, with asset limits and a stacked phase-out chart showing how each one tapers as income rises.
- Maximum mortgage applies the Nibud financing-burden norms to one or two incomes, using the actual rate or the stress-test rate, existing debts checked off by type, the NHG limit, the property’s WOZ value and your own funds, plus energy-label and renovation bonuses for extra borrowing room. It shows the net monthly cost after mortgage-interest deduction and a sensitivity analysis of how your capacity moves with rate and income.
- Savings & interest projects compound growth, but flexibly. You build your deposits in multiple phases (monthly, quarterly, yearly, or one-off, with negative phases for withdrawals), choose how often returns compound, and compare several return scenarios side by side, each with an optional low, expected, and high band. You can fold in box 3, either the current notional-return system or the 2028 proposal, or both to compare. The result is an interactive chart with uncertainty bands, a breakdown of each deposit phase’s contribution, and a year-by-year table. It’s the calculator I use most myself, to plan my own future.
- Box 3 2028: market swings uses a Monte Carlo model (hundreds of return paths) to simulate what the proposed tax on actual returns does under volatile markets. It sets the 2028 proposal against the current notional system and against pay-on-sale taxation as a benchmark, shows the tax per year (the notional system always levies, while the proposal spikes in good years and drops to zero or a refund in loss years), a fan chart of your net wealth with percentile bands, and the probability that you pay less under the proposal. You set the loss carry-back yourself, and can read through the sting in the tail: a December peak followed by a January crash, and the 2027 transition gap.
One source of truth. Every bracket, credit, norm, and threshold lives in a single typed data layer, organised per tax year, so every calculator uses identical figures. The current year’s data is verified against the primary sources (Belastingdienst, Nibud, Dienst Toeslagen, NHG, Rijksoverheid, CBS) with a recorded verification date, and the annual update process is documented step by step so next year’s figures slot in cleanly. The allowance calculations are tested against the official worked examples, and the mortgage logic against the Nibud reference scenario, so the output isn’t just plausible, it matches the source.
Live mortgage rate. The default rate in the mortgage calculator comes from De Nederlandsche Bank. A small script pulls the current DNB average for new home-purchase loans before each build, and falls back gracefully to the last known value if the API is unavailable, so the build never breaks on a network hiccup.
Privacy by Design
The thing I cared about most is that Geldhoek never sees your numbers. Every calculation runs entirely in your browser. For visitor statistics I use Rybbit, a privacy-friendly, GDPR-compliant analytics tool with no cookies. It only gives me aggregate figures, like which pages get visited, and never what you type: query-parameter tracking is turned off, so the calculator state in the URL stays out of view. Even the font is self-hosted. The only thing the site stores is what you put in the URL: the calculator state is serialised into query parameters, which means you can bookmark a scenario or share it with someone by copying a link, without any account or server-side session. Your salary, your mortgage, your situation: none of it leaves the page.
The Technical Foundation
Geldhoek is built on Astro, rendering static HTML at build time. The landing page ships zero JavaScript, which keeps it fast and good for SEO, and the interactive calculators are React islands that only hydrate on the pages that need them. Styling is Tailwind v4, the fiscal calculations are pure TypeScript functions decoupled from the UI and covered by unit tests, and structured data on each calculator page helps it surface in search. It’s a deliberately boring, durable stack: static where it can be, interactive only where it has to be.
What I Learned
I now genuinely understand the Dutch tax system. Getting each calculator right meant digging into the rules until they actually clicked, and only then do you see how much sits under the hood. That a maximum mortgage doesn’t follow directly from your income but from the Nibud financing-burden norms, with a stress-test rate decoupled from the real one, and that a student loan drags down your borrowing room through a weighting factor. That net salary is a stack of brackets and four tax credits that each phase in or out at their own income thresholds. That the allowances have their own tapers and asset limits that interlock. That knowledge started as a means to build the tool, but it has become one of the most valuable things the project gave me.
The Monte Carlo model was new to me. For the box 3 calculator I wanted to show what market swings do to the assessment, which meant learning Monte Carlo simulation: drawing hundreds of possible return paths from a distribution and looking at the spread of outcomes rather than a single average. A smooth projection hides exactly the sting I wanted to surface. Only by simulating the paths did it become visible how a December peak followed by a January crash plays out. A technique I didn’t know before, and one that is now in my toolbox.
Current Status
Geldhoek is live with seven calculators and a small library of explanatory articles on topics like why a pay raise disappoints and what buying a house costs beyond the mortgage. It’s free, has no ads, and asks for nothing. The goal stays the same: clear answers to real Dutch money questions, built on figures you can trace back to their source, with your data never leaving your own browser.