
Most households in the Netherlands now have a smart meter with a P1 port, a standardised data interface that exposes real-time electricity and gas readings. With a small dongle like the HomeWizard P1, that data becomes available as a JSON API on your local network. The readings are there, but without something collecting and storing them, they are lost. I wanted a system that would quietly gather every data point, store it in a proper time-series database, and tell me once a month what my household actually consumed, how much was fed back to the grid from solar panels, and how that compares to the month before.
The Problem With Existing Options
There are plenty of energy monitoring apps, but most of them come with trade-offs I didn’t want. Some require cloud accounts and send your data to third-party servers. Others offer dashboards but no structured reporting. The HomeWizard app itself shows live readings and some history, but it doesn’t give you a monthly summary split by tariff that includes both import and export, and it doesn’t let you query the raw data. With solar panels on my roof, I specifically wanted to track how much electricity goes back to the grid, broken down by normal and off-peak tariffs, since that directly affects what you pay under the Dutch net metering rules.
What I wanted was simple: a self-hosted solution that collects readings at regular intervals, stores them locally, and generates reports I can actually use. No cloud dependency, no subscription, full control over the data.
How It Works
The system has two main components running in Docker: a collector and a reporter.
The collector polls the P1 meter’s HTTP API at a configurable interval (default every 60 seconds) and writes each reading to QuestDB, a time-series database optimised for exactly this kind of append-heavy, time-ordered data. Every reading captures the current power draw, cumulative import and export totals split by normal and off-peak tariffs, and gas consumption. For households with solar panels, the export readings track exactly how much electricity is fed back to the grid per tariff.
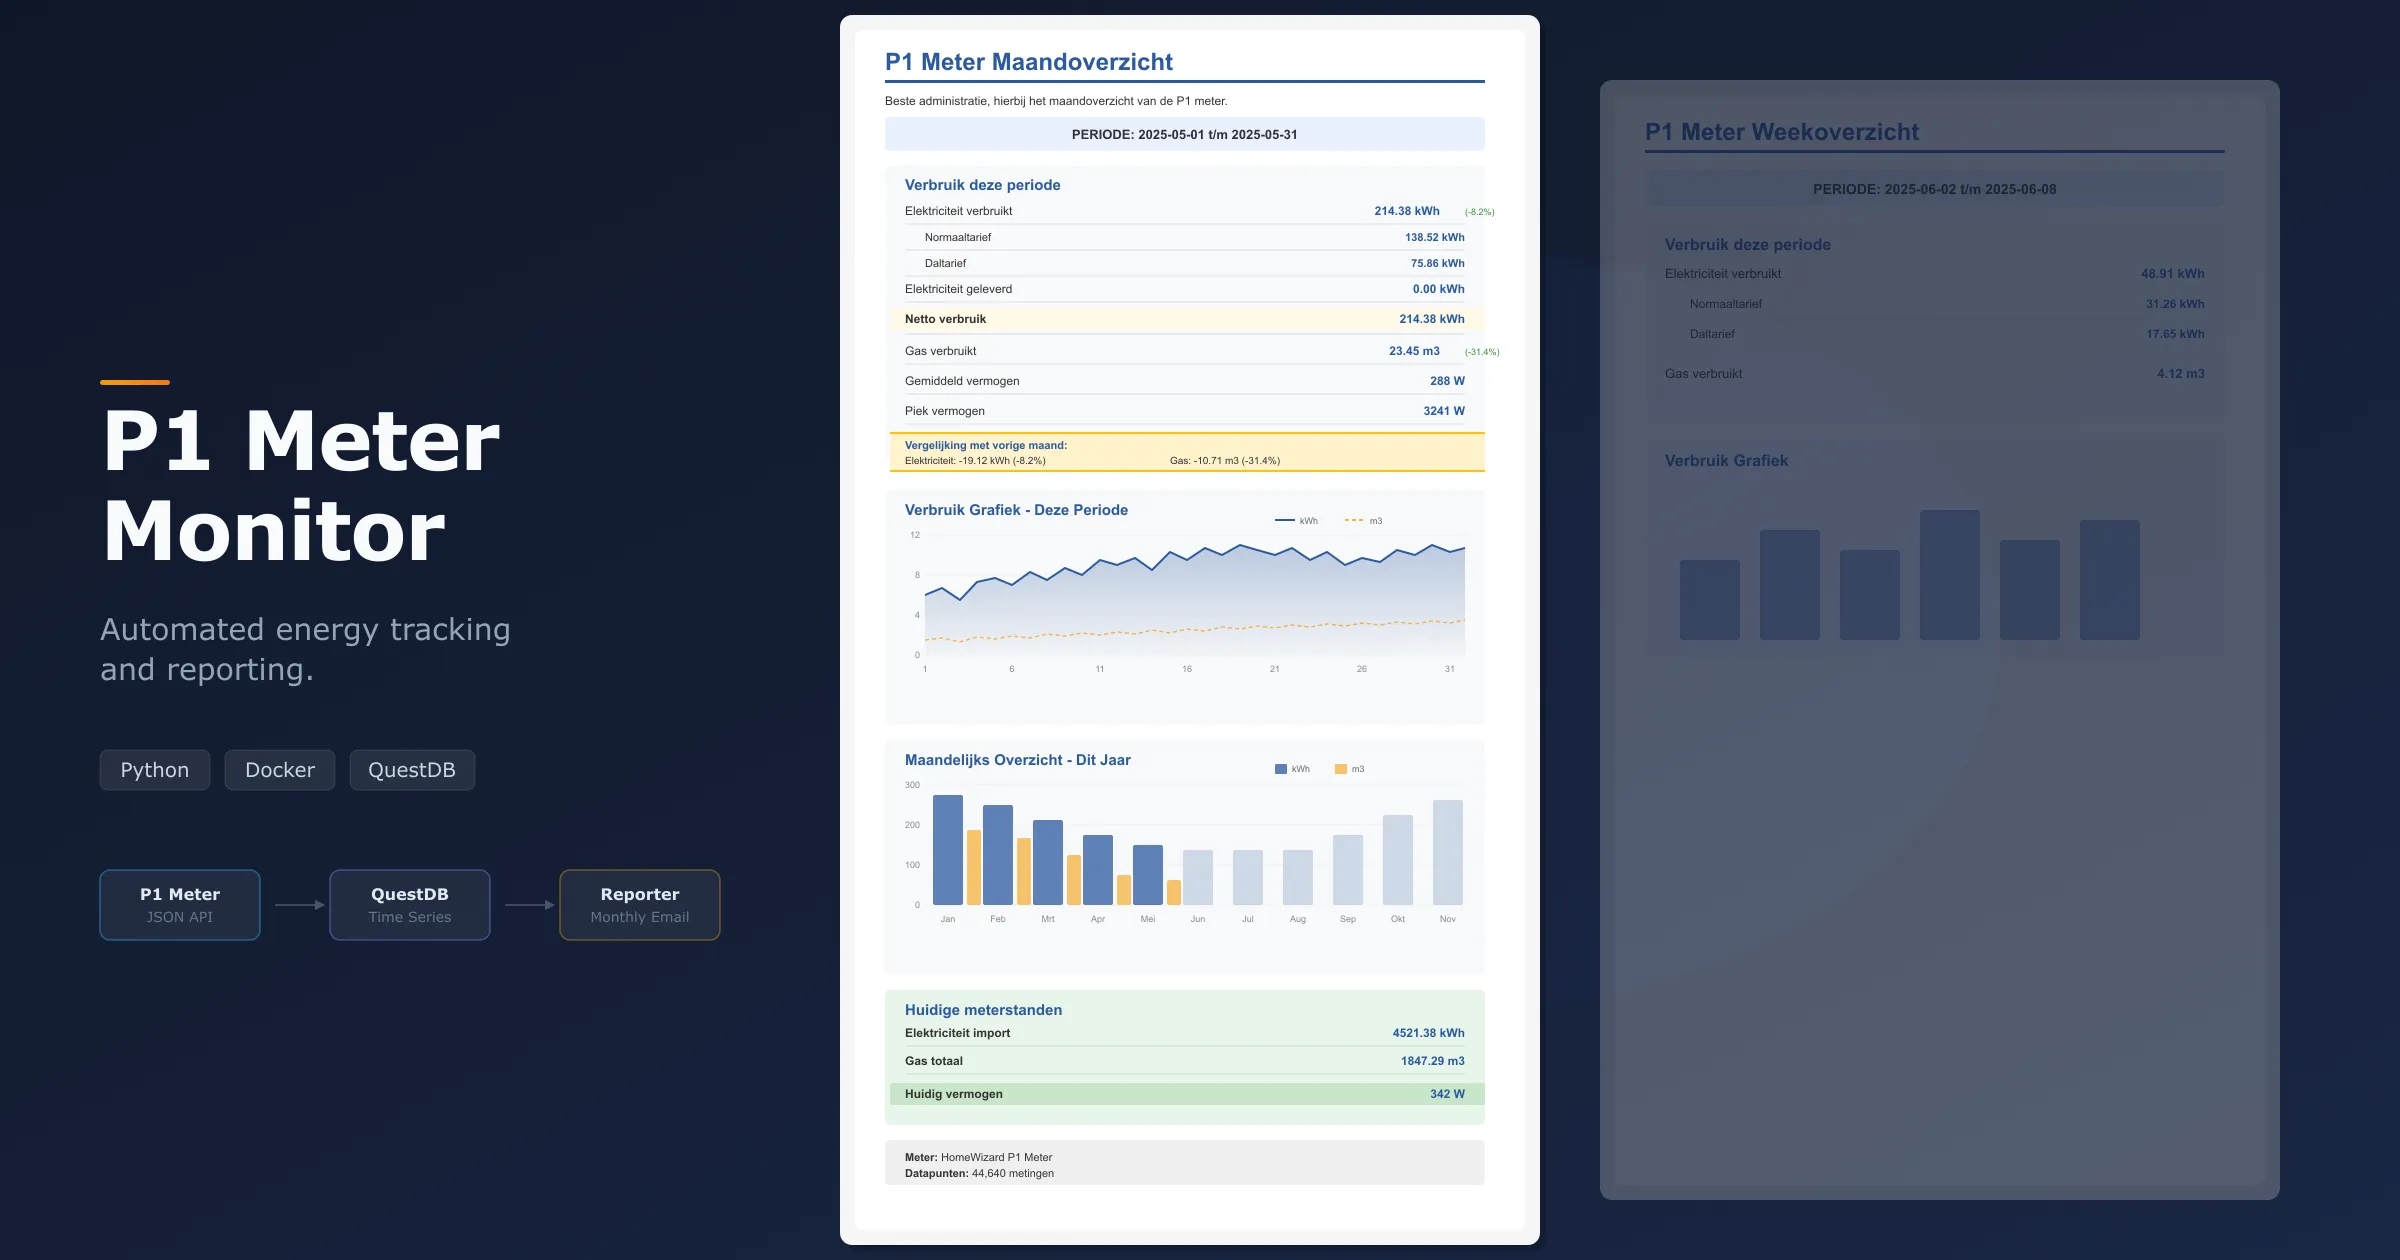
The reporter runs on a schedule using APScheduler. On the first of each month, it queries the stored data, calculates consumption and production per tariff, computes the net consumption, and sends an HTML email with a full breakdown. Each monthly report automatically includes a comparison with the previous month, showing the difference in electricity and gas usage both in absolute numbers and as a percentage, colour-coded green or red so you can see at a glance whether you used more or less. There’s also an optional weekly CSV export for anyone who wants to do their own analysis in a spreadsheet.
Reports and Queries
The monthly report is rendered as an HTML email in Dutch, since that matches the tariff structure it reports on (normaal- and daltarief). It shows exactly how many kilowatt-hours were consumed and exported at each rate, the net consumption after subtracting solar production, gas usage, and average and peak power draw. The month-over-month comparison section highlights whether your electricity and gas usage went up or down compared to last month, which is especially useful for spotting seasonal patterns or the impact of changes like adding insulation or adjusting heating habits. The idea is that you get one email a month and immediately know where you stand.
The report also includes two graphs: a daily consumption chart for the period showing both electricity and gas as separate lines, and a yearly bar chart that puts the current month in context alongside previous months.
For anything beyond the standard report, QuestDB’s web console is available on the local network. The raw data sits in a single p1_meter_data table, so running custom queries is straightforward. Want to know your daily consumption over the past week, or see how much your solar panels produced last Tuesday? A few lines of SQL will get you there.
Reports can also be generated manually from the command line. You can specify preset periods like month, this-week, or yesterday, or pass a custom date range. The CLI can send the report as an email or write it to a CSV file.
Deployment
Everything runs in Docker Compose. Configuration lives in a single .env file: the meter’s API URL, SMTP credentials for email delivery, and report recipients. Starting the system is a docker compose up -d and it begins collecting immediately.
For production use, there’s a separate Compose file that pulls a pre-built image from the GitHub Container Registry instead of building locally. A CI/CD workflow publishes new images automatically on push. Backup and restore scripts handle the QuestDB data volume, so nothing is lost if a container needs to be recreated.
What I Learned
Building this project reinforced something I keep finding to be true: the best infrastructure is the kind you forget is running. The collector has been writing readings every minute for months without intervention. The monthly email just shows up. I only interact with the system when I actually want to look at the data.
QuestDB turned out to be a great fit. It’s lightweight enough to run alongside the collector on modest hardware, and its SQL dialect handles time-series aggregations natively. Sampling by day, week, or month is a single clause, not a manual GROUP BY on extracted date parts.
The email templates being in Dutch was a deliberate choice. Energy tariffs in the Netherlands follow a specific structure, and building the report around that structure made it immediately useful rather than generic. It’s easy enough to adapt for other languages or tariff models, but starting with something concrete and specific turned out to be more practical than trying to be universal from day one.
You can find the repository at the bottom of this page. It includes full setup instructions and example queries.
Do you have feedback or questions about this project? Or are you looking for help with software development? Feel free to get in touch.